
Industry data for the public adjuster desk.
When a carrier tells you a file is "on track," these are the numbers that tell you whether it actually is: cycle times, settlement benchmarks by peril, compensation data, and claim-volume forecasts.
Every statistic on this page cites its source, and the sources are listed at the end of each post. If a number could not be sourced, it was left out.

Industry data
Hail States Have the Newest Roofs in America
Verisk's 2026 roof data shows hail states hold the youngest roof stock in the country, which moves the real fight to endorsement text and reporting windows.
2 min read

Industry data
The Integration Verisk Killed Is Why It Must Now Buy AccuLynx
A Delaware court ordered Verisk to pursue its $2.35B AccuLynx acquisition after finding that Verisk's own cancelled Xactimate pricing integration caused the FTC delay it tried to exit on.
8 min read

Industry data
The Median Florida Property Claim Closes in 30 Days. The Average Is 66.
Florida's insurance regulator reports a 66-day mean and a 30-day median for property claim closing time, on the same 456,200 claims closed in 2025. The gap is a long tail, not carrier size.
3 min read

Industry data
Claim Denial Rates by State: NAIC's Real 2026 Numbers Behind the Viral Ranking
NAIC's own MCAS data shows the real state-by-state claims-closed-without-payment ratio, and the viral “denial rate” rankings circulating in 2026 are measuring insurer domicile, not claims.
9 min read

Industry data
Public Adjuster Fee Caps by State: Why “10% Everywhere” Is a Myth (2026)
Most states set no statutory cap on public adjuster fees at all. Where caps exist they vary — Florida’s everyday ceiling is 20%, New York’s is 12.5%, Texas is a flat 10% — and the famous “10%” is often a declared-emergency rate. What the statutes actually say.
3 min read
Industry data
Contractor Overhead and Profit: "Three Trades" Isn't the Test
The trade-count rule public adjusters argue at the desk appears in neither of the appellate decisions that control overhead and profit on an ACV payment. What the courts asked instead, and the clause that decides it.
3 min read
Industry data
The McKinsey Documents: How Allstate Turned Claims Into a Profit Center
150,000 pages of internal slides show how insurers turned claims into a profit center. What the Allstate–McKinsey documents mean for every claim you work.
7 min read
Industry data
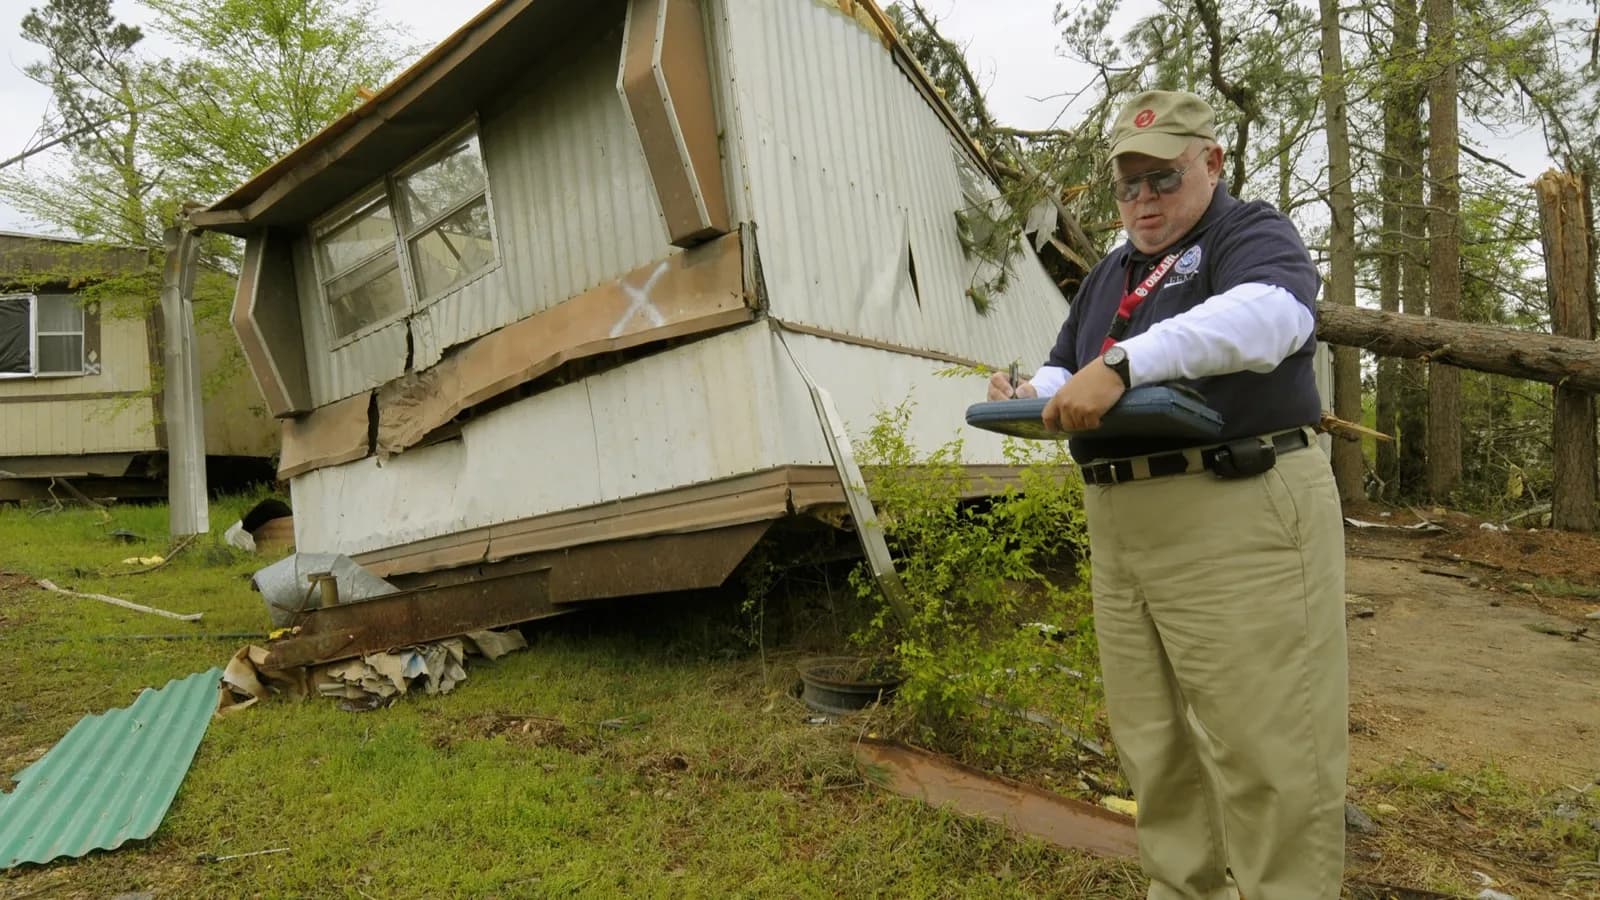
The 2026 Public Adjuster Claim File Anatomy: How Many Photos, Pages, and Days a Real File Holds
A breakdown of photo counts, page totals, document categories, and settlement timelines drawn from public adjuster field practice.
8 min read
Industry data
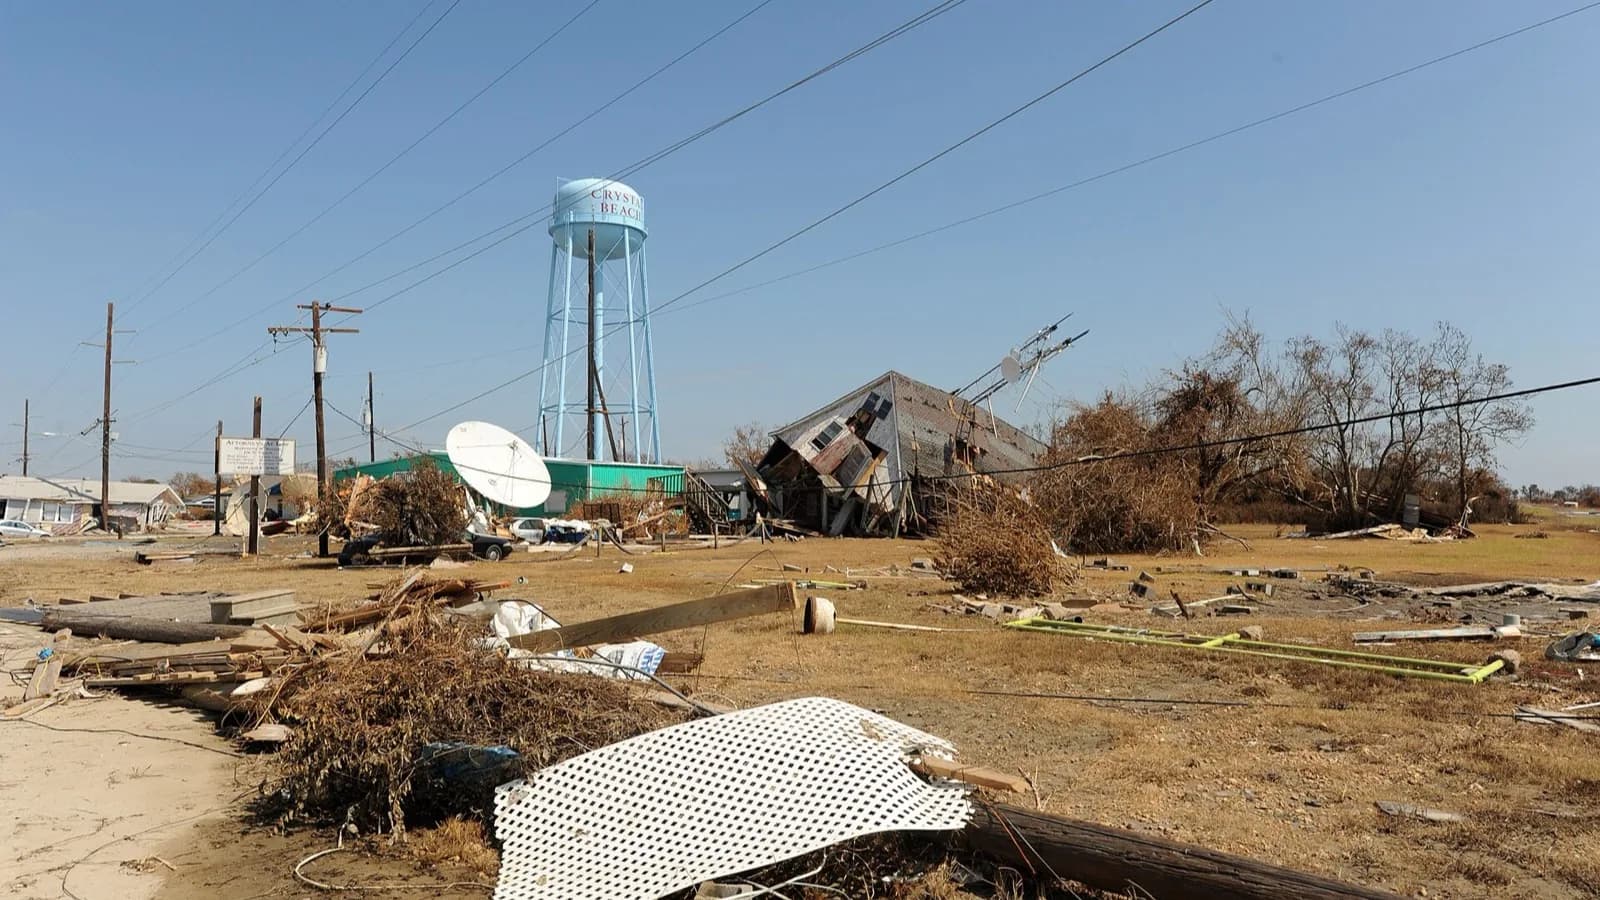
Cycle Time After CAT Events: How Long Carriers Really Take After a Named Storm
Closure rate isn't cycle time. What the public catastrophe data hides about how long carriers take to actually pay after a hurricane — and the statutory clocks that give adjusters leverage.
8 min read
Industry data
Average Settlement Time by Peril: Hail, Wind, Water, and Fire — A 2026 Benchmark
There is no clean average-days-to-settle figure by peril. What there is: a predictable map of where hail, wind, water, and fire each hide their delay — and a statutory clock that runs the same for all of them.
6 min read

Industry data
Hail Claim Density Map 2026: A Public Adjuster's State-by-State Volume Forecast
Where 2026's hail claim volume is concentrating, read off State Farm's $5.6B payout map, and what the state-by-state movement means for a public adjusting firm's calendar.
6 min read